Introduction
The 2023 LTSS State Scorecard (the Scorecard) is a compilation of state data and analysis based on a new vision of a high-performing state long-term services and supports (LTSS) system.1 Released every three years, the Scorecard uses data from a wide range of sources to describe how state LTSS systems are performing. Our intention is to identify strengths and weaknesses in state systems to spark and inform the development of actionable solutions at the local, state, and national levels— solutions that respond in meaningful ways to individual preferences and family choices and care needs as well as to new pressures and challenges. We hope that it will help everyone who is part of these state systems to take action that will transform and modernize them.
This fifth edition of the Scorecard relies on indicators that have been tracked since the first Scorecard in 2011 to show trends over time. It also includes 20 new indicators and new ways of analyzing and displaying data to provide a more comprehensive picture of state performance. We made revisions to the five dimensions of high performance and organized states into performance tiers. All of these improvements are intended to offer states the clearest information we can about their performance as they rebuild and reimagine their LTSS systems going forward.
New Vision
This Scorecard is based on an updated vision of high-performing LTSS systems. That vision includes
the following elements:
- Affordability and Access. Consumers can easily find and afford services, with a meaningfully available safety net for those who cannot afford services. Safety net LTSS do not create disparities by income, race/ethnicity, or geography.
- Choice of Setting and Provider. A person- and family-centered approach allows for consumer choice and control of services (including self-directed models). A well-trained and adequately paid workforce is available to provide LTSS. Home and community-based services (HCBS) are widely available. Provider choice fosters equity, and consumers across communities have access to a range of culturally competent services and supports.
- Safety and Quality. Consumers are treated with respect and preferences are honored whenever possible, with services maximizing positive outcomes—including during and after care transitions. Residential facilities and HCBS settings are adequately staffed and are prepared for emergencies. Policy-, system-, and practice-level efforts reduce and/or prevent disparities in quality and outcomes.
- Support for Family Caregivers. Family caregivers are recognized and their needs are assessed and addressed, so they can receive the support they need to continue their essential roles. A robust LTSS workforce limits over-reliance on family caregivers. Family caregiver supports are culturally appropriate and accessible to all communities.
- Community Integration. Consumers have access to a range of services and supports that facilitate LTSS, including safe and affordable housing. Communities are age friendly and supported by state Multisector Plans for Aging. Policy and programming that facilitate livable communities also drive equitable communities.
Equity in a High-Performing LTSS System
The new vision of a high-performing LTSS system centers on equity, which therefore will serve as a basis for the Scorecard now and going forward. With significant input from our advisors, we developed the following definition with regard to equity in LTSS:
- Equity in a high-performing LTSS system means that high performance is shared across all groups, defined by race/ethnicity, gender identity, sexual orientation, age, disability status, and income, among others.
- States where every measured group does well will score highly, and states in which some groups perform poorly will score lower.
We recognize that even an “average” LTSS experience may not be available to all communities— and that an LTSS system cannot be said to perform well unless it does so for everyone.
The limited availability of demographic data for LTSS recipients is a significant barrier to this effort. Our ultimate goal is to provide a comprehensive look at how different groups experience all aspects of state LTSS systems, but that is not achievable at this time. There are too many gaps in data collection, data reporting and data quality. However, considering this goal to be an imperative, we saw an opportunity with this Scorecard to take the first step, with race/ethnicity data only.
High-Level Findings
OVERALL PERFORMANCE AND STATE RANKINGS
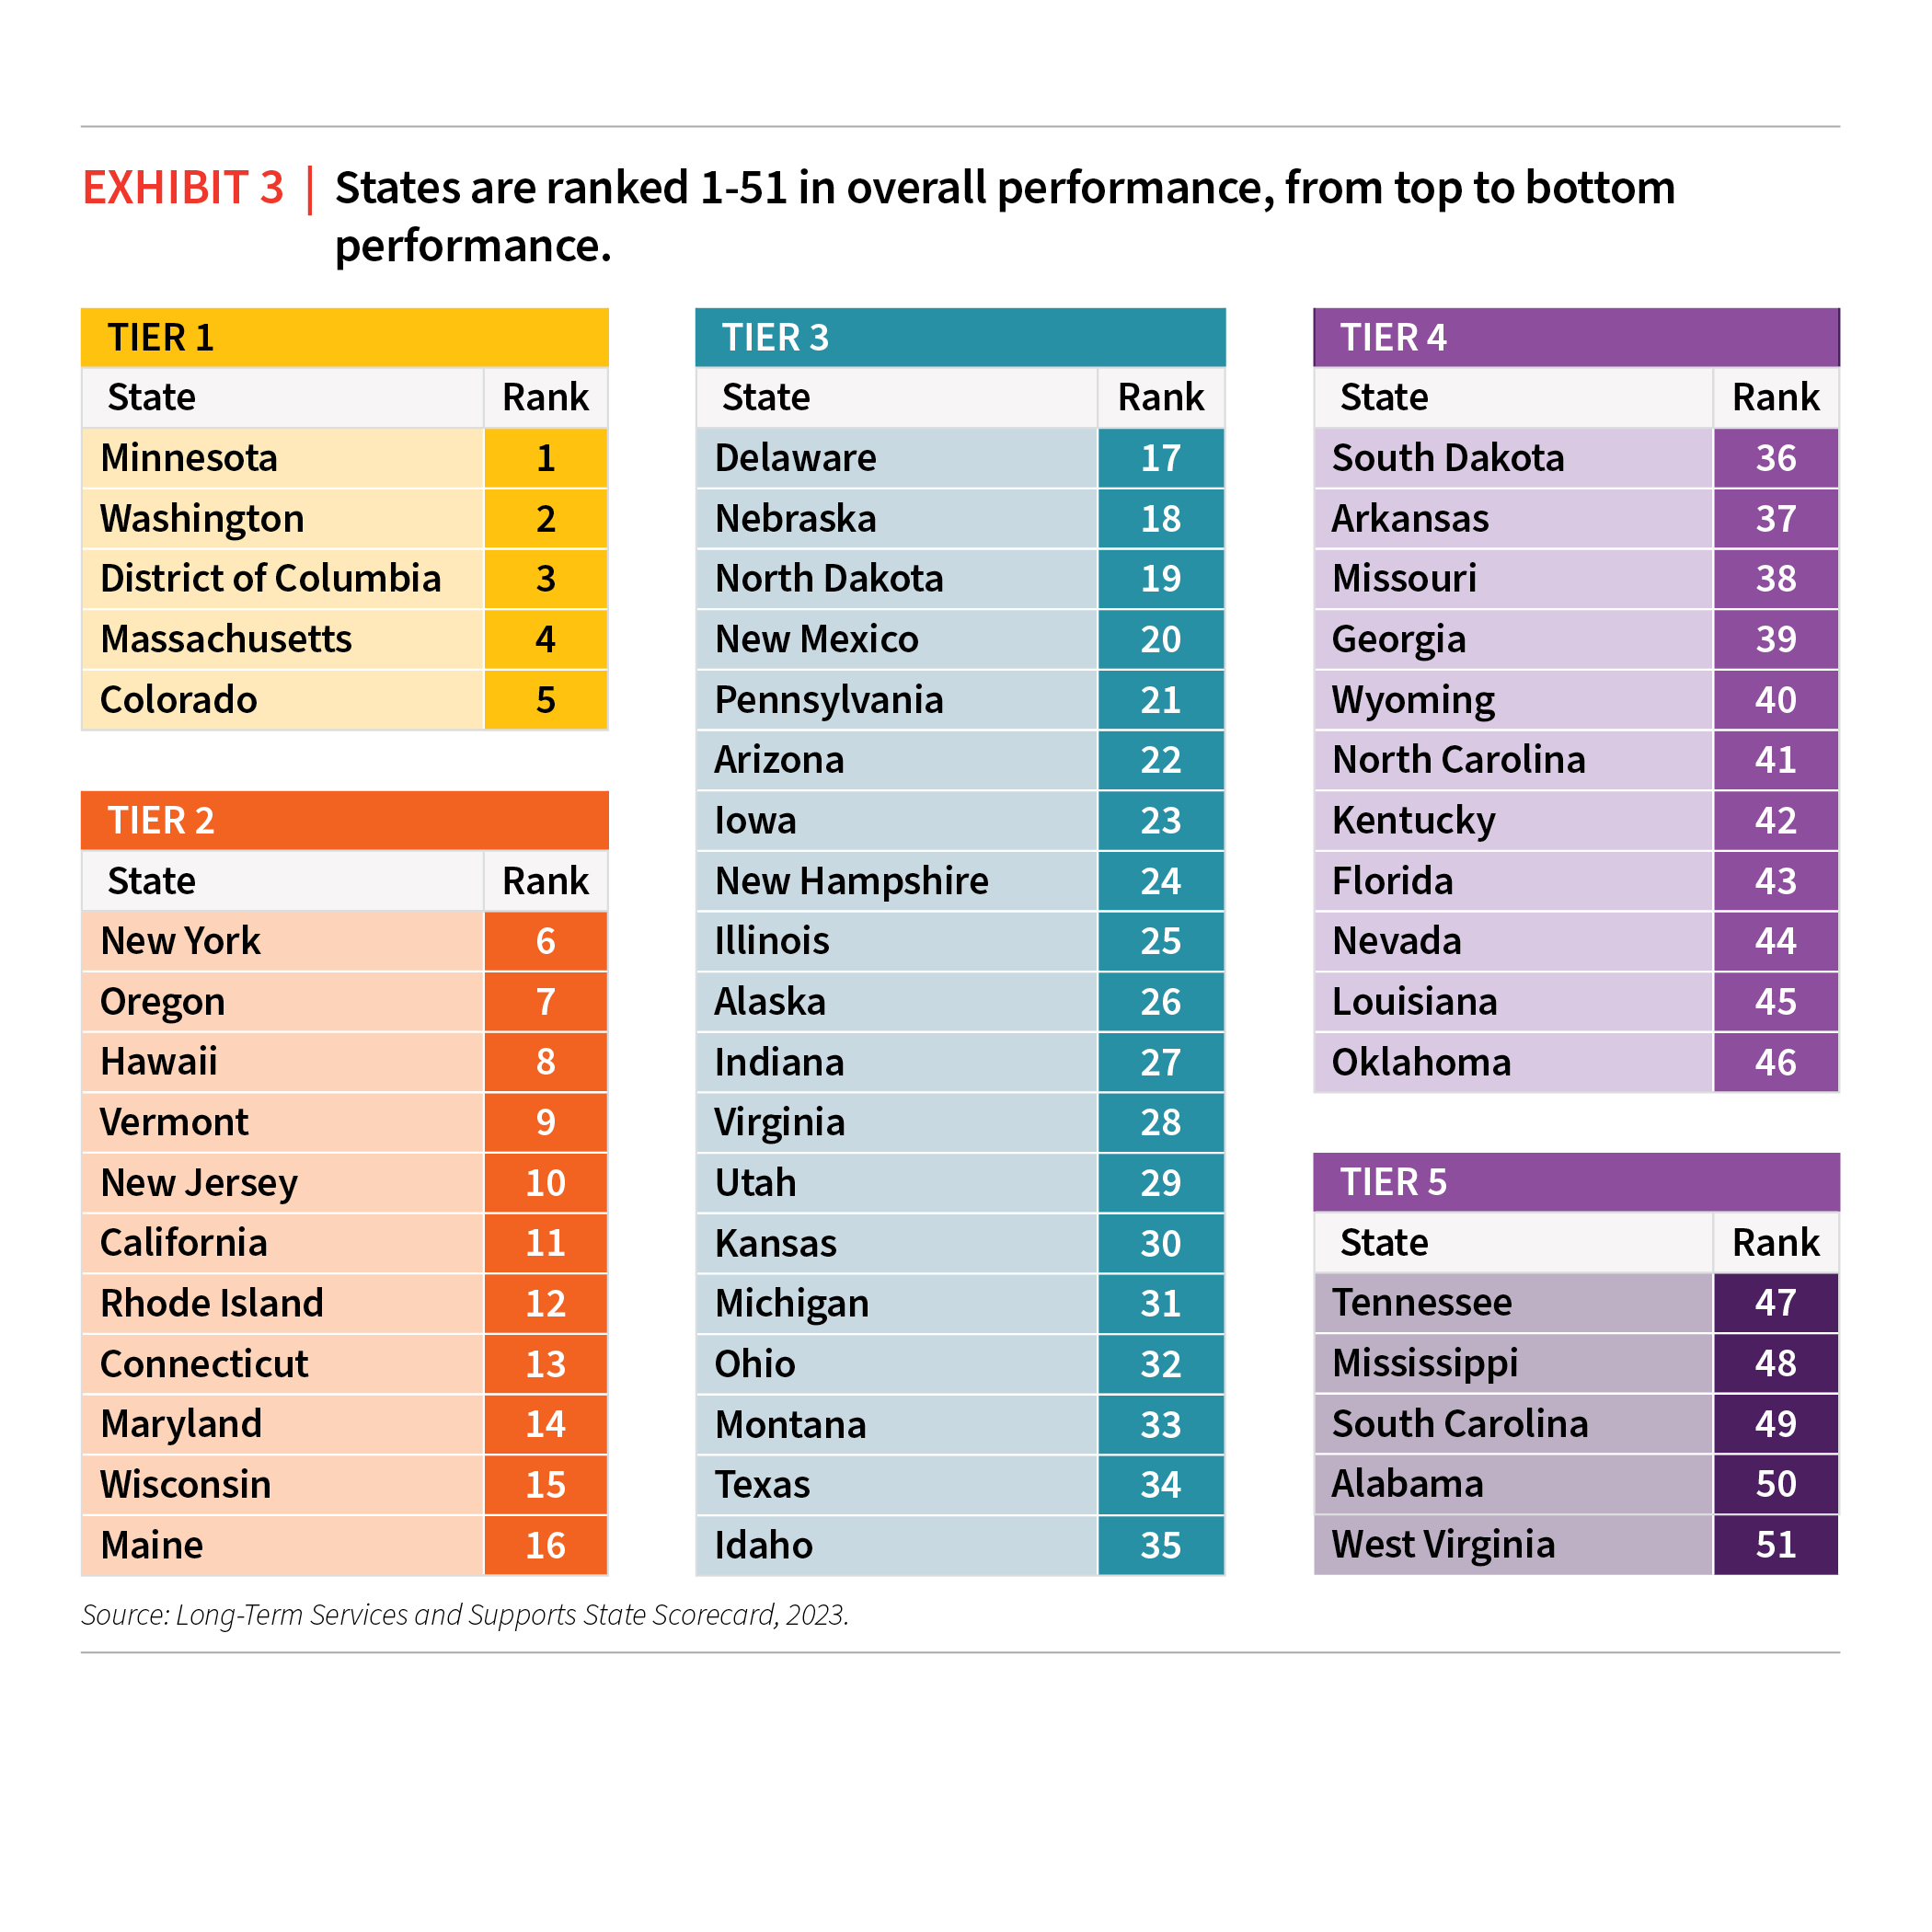
As with previous Scorecards, states are ranked 1-51 relative to one another for each indicator, each dimension, and overall. While previous editions of the Scorecard have grouped states into equally sized quartiles, this edition groups states into performance tiers, to better reflect the natural distribution of state performance, where historically, most states fall closely together in the middle and very few states perform significantly above or below the national average. Only five states (Colorado, District of Columbia, Minnesota, Washington, Massachusetts) consistently scored high enough across all 50 indicators to reach the top tier of performance. See the Overall Map above and Exhibit 3 below.
ACCELERATING PROGRESS
For the indicators in which we can track change over time, more states made significant progress in the last three years (2020–2023) than the previous three years (2017–2020). For the first time, the Scorecard finds more than half of Medicaid LTSS spending for older people and adults with physical disabilities went to HCBS, at a rate of 53 percent in FY 2020 (from which the 2023 Scorecard scores and ranks states). In addition, 12 states spend the majority of Medicaid LTSS funding for older people and adults with physical disabilities on HCBS (up from seven states in 2009). The indicator showing the most improvement nationally is Self-Direction Enrollment, which increased by 10 percent or more in 35 states. Some states recording massive increases in enrollment across their self-directed programs of 500-1000 percent. Since the first Scorecard edition, the total number of people who self-direct services more than doubled from just under 740,000 in 2009 to more than 1.5 million in 2021.
SUPPORT FOR FAMILY CAREGIVERS
Among the five dimensions, the Support for Family Caregivers dimension shows the most consistency from the previous 2020 Scorecard. This in part reflects significant progress documented in previous editions of the Scorecard. States that already have policies that support family caregivers in place do not need to change but rather maintain their policy framework and ensure effective implementation of laws passed. The pace of change between the 2020 and 2023 Scorecards was relatively slow and states have many opportunities for further action. States that do well supporting family caregivers tend to have stronger overall LTSS systems; the scores and ranks of the Support for Family Caregivers dimension showed the highest correlation out of all five dimensions to overall scores and ranks.
COVID-19, NEW INDICATORS, AND STATE POLICY CHOICES
For this Scorecard, we used only data from 2020 and later to capture how the LTSS system faired during the pandemic. From the Scorecard data alone, we cannot determine whether observed changes are because of COVID-19, associated with the response to COVID-19, reflective of existing trends that were magnified by the pandemic, or entirely unrelated. However, we know from a wide body of other recent research how COVID-19 impacted people in LTSS systems, including high rates of cases and deaths, social isolation, and more. With this context in mind, for indicators we could track over time, there were significant changes to indicators of supply, safety, and cost that are likely related to the pandemic and how states and the federal government responded.
Altogether, there are 20 new indicators that show how states compare in key areas related to LTSS workforce, nursing home safety and quality, programs targeted to people with disabilities (exclusively or in addition to older adults), housing, transportation, and performance across different racial and ethnic groups. Across all the indicators, those that pertain to access and enrollment in public programs and state Medicaid policy decisions are highly aligned with how states perform overall. Because Medicaid pays for the majority of LTSS, the choices that states make setting Medicaid policy have broad impacts on the entire LTSS system.
INNOVATION POINTS
There are six new “innovation point” indicators to recognize states for taking groundbreaking steps to improve their systems. In LTSS, cities, counties and states can serve as laboratories of innovation. However, for innovations to scale to the statewide level, they must be well-understood by state leaders and policymakers and supported by broad coalitions of people across sectors.2 We found that states are innovating across all regions and in a wide range of overall system performance, with 28 states credited for at least one of the innovations. Four states stand out for getting full or partial credit for three or more innovations (Colorado, California, Missouri, and New York). It is notable that all four include Multisector Plans for Aging as one of the innovations.
LTSS WORKFORCE
A strong direct care workforce is foundational to overall LTSS system performance. This workforce includes home health and personal care aides working in HCBS and certified nursing assistants working in nursing homes, among many other job titles. Direct care workers provide hands-on support to people with LTSS needs. Worker shortages and workforce instability have been major challenges for many years and were exacerbated by the COVID-19 pandemic. New indicators related to wages, turnover, and staffing levels shed light on what states are doing to recruit and retain workers. All states in the top two performance tiers demonstrate better-than-average performance specific to the workforce indicators.
EQUITY IN LTSS
Seven of the nine indicators for which we were able to analyze race/ethnicity data pertain to residents in nursing homes because of the federal requirements for nursing home reporting. No analog data resources exist for HCBS, but future editions of the Scorecard may provide more information to the extent that government agencies begin to collect and make public more HCBS data.
The Scorecard spotlights key areas for improvement with respect to equity for nursing home residents. These include hours of care per patient per day, residents with low care needs, top rated facilities, and rates of pressure sores. Using the AARP Livability Index, the Scorecard also found differences across neighborhoods with different racial/ethnic make-ups in the assessment of housing and transportation systems.
Insights and Opportunities
In reflecting on 2023 Scorecard findings overall, the following insights arose—each coming with opportunities to take action.
- Movement to shift balance to HCBS for older adults and people with physical disabilities is reaching a tipping point.
- Coalitions are more important than ever.
- Opportunities abound to scale innovations, especially to support family caregivers.
- Glaring gaps in data persist and more is needed to better understand equity in LTSS.
- A strong direct care workforce is essential.
1 “High-Performance Revisited: Examining Long-Term Services and Supports System Performance,” Long-Term Services & Supports State
Scorecard, November 10, 2022, https://ltsschoices.aarp.org/resources-and-practices/examining-long-term-services-and-supports-system-performance.
2 Susan Reinhard, Jane Tilly and Brendan Flinn, “From Ideation to Standard Practice: Scaling Innovations in Long-Term Services and
Supports,” November 2022: https://ltsschoices.aarp.org/resources-and-practices/ideation-standard-practice.